
Tech
Maximizing Financial Performance: How to Develop a CFO Dashboard


Introduction
Financial CFO dashboards can enhance an organization’s strategic direction regarding the financial component of its business. These are aspects that, through these dashboards, CFOs can monitor, evaluate and report on financial numbers that are turning into risk management and new opportunities. It is an imperative gadget in your portfolio that supports the creation of realities or the situating of problems and threats regarding their financial implications. Learn to build a CFO dashboard for enhanced financial tracking and decision-making.
A CFO dashboard offers specific details of financial ratios, budget control, and cash flow, which is vital in strategic planning at the financial level. It provides better visibility regarding the organization’s economic health, helps in the decision-making process, and helps in the timely management of resources and risks, thus ensuring the best financial outcomes and strength and stability in an organization.
Defining the core purpose of a CFO dashboard
Key objectives
A CFO dashboard fulfils several main goals that are crucial for the financial management process:
- With the help of chosen approaches, one can track actual records of revenues, expenses, and profitability in real-time, thus being aware of tendencies and changes in financial outcomes.
- It helps one to analyze by drilling down to more detailed financials that assist them in detecting cost drivers, cost trends, and prospects for cost reduction or revenue enhancement.
- It also equips full reporting, providing detailed, incredibly customizable reporting to give an accurate idea about the company’s wheel of operation and thus help in strategic planning without requiring additional external tools.
Combined with all other functionalities, it enables CFOs to manage the company’s financial health, financial resources, and corporate development for sustainable value creation.
Stakeholder considerations
Identifying and appreciating stakeholders’ needs facilitates the achievement of their objectives regarding the dashboard. For executives, it offers the big picture and performance parameters. Managers use operational data and KPIs to improve processes. Besides, analysts need detailed or drill-down capabilities for better analysis. Shareholders need some measures to show financial performance and future possibilities. In this way, communication with all the necessities mentioned above changes the dashboard into an effective instrument of decision-making and transparency in the company.
Essential metrics to include
Financial health indicators
Cags flow gives efficiency and sustainability to business operations regarding liquidation. Gross and net profit margins are vital financial ratios showing how profitable a business entity is in terms of the revenues earned. ROI estimation helps determine the effectiveness of investments in terms of the cost incurred in the particular investment. These measures are used to analyze a company’s financial ability, profitability, and efficiency to properly plan and control its operations.
Operational efficiency metrics
Operational efficiency metrics include:
- Operational Costs: Measuring, recording, analyzing, and controlling activities related to costs like production, labour, and many others that are considered expensive.
- Productivity Ratios: Express production in terms of its efficiency with input resources, such as the number of units produced per labour hour or total revenues per total employee cost.
- Resource Utilization: This measures the optimal utilization of consumable items, including materials and equipment.
They are useful tools that allow the company to conduct detailed analyses of its performance and identify effective levers that will improve its competitiveness and profitability.
Risk management metrics
Critical measures of managing financial and non-financial risks associated with compliance affect the stability and integrity of an organization. These include Risk Exposure, which covers the measurement of exposure to market risk, credit risk and operational risks, among others. Legal Compliance and Operational Risk Management metrics measure the degree of compliance with the law and organizational guidelines to reduce legal and operational exposure. Moreover, risk control effectiveness measures have been applied to minimize risks. These metrics facilitate early identification of the risks and their mitigation, compliance with the regulation requirements, financial risks exposure, and protection against any losses or adverse impacts to the company’s reputation.
Integrating real-time data
Benefits of real-time data
The availability of a real-time data stream has a lot of benefits in marrying the business with financial conditions that prevail in the market, the status of its cash flow and the overall performance. This makes decisions to be made at a faster pace, making it possible for businesses to exploit opportunities and avoid risks that are likely to affect their business operations. Real-time data aids in better forecasting lead to better logging and presents better and more efficient results in terms of financial reports. In addition, it prescribes the anticipation and control of cash flows, efficient resource utilization, and the timely adjustment of strategies to correspond with economic changes to continue on a path of growth and competitiveness.
Implementing real-time data feeds
Real-time data feeds typically need to be implemented into a dashboard, which calls for sound technologies like data integration platforms, such as Apache Kafka and Microsoft Azure Stream Analytics. Integrate the application for easy data connection and use APIs to encourage compatibility with various sources. Cloud solutions handle big data and increase the application’s efficiency. Tools like Tableau or Power BI are helpful and can help with accurate data time visualization. Calculated alerts and monitors guarantee that the information collected is correct and dependable for choice-making.
Visualisation techniques for effective communication
Selecting the Right Visualization Media
It is advisable to exercise caution when choosing the visualizations, and the two significant factors include the type of data and goals because they give an overview of how they are used differently. Bar graphs should be used to compare the categorical data and the trends with time, line graphs should be used to compare the trends in continuous data, and pie charts should be used to compare the proportion or percentage of the whole. When it comes to relationships of variables, such as numerical data and densities, scatter plots and heatmaps will be helpful. Select such elements as drill-down and filters for better-detailed data analysis while remaining transparent to the user for better decision-making.
Designing for clarity and impact
This should be done to clearly distinguish between colours and fonts. Organize visual components methodically to control their reception by the audience. Use high-flying descriptions and labels for these truths to introduce meaningful contexts. Publish easy-to-understand charts and graphs that depict trend and comparison information well. Use the interactive elements selectively to make the user inevitably interested in the interface but not overloaded.
Customization and Flexibility
Tailoring the Dashboard to the CFO’s Needs
Modify the page according to the segment of interest by making financial ratios such as cash flow, profitability, and budget an easily visible section for the CFO. Use of items to post results of organizations and their financial health on balance sheets, and important KPIs, among others. Integrate the ability to follow the drill-down for detailed information analysis, which will be helpful for financial data. Make sure to view the all-important dashboard in real-time on multiple devices. Orient the reports and visuals according to the organization’s strategic objectives for more efficient and effective decisions and better financial control.
Scalability and adaptation
Another factor that needs to be considered is that the dashboard must be scalable; this is why data integration tools that are flexible and can accommodate various data sources and amounts of data should be chosen. Lease out solutions in the cloud for expansibility and efficiency. Monitor integrating new data inputs and analytics shapes into the system’s design with modular components and APIs. Sort listed features by their importance and prioritize updating some by altering business requirements and users’ opinions on the dashboard’s functionality. Carry out practical testing mechanisms that allow for the dashboard to perform well when there is a large amount of data being input or when there is a small amount of data, as this will determine the efficiency of the dashboard.
Security and accessibility
Ensuring data security
Secure the integrity of the financial information disseminated on the company’s dashboards through adequate encryption methods for the transfer and storage of data. Employ RBAC to limit access to the dashboard in a manner that is associated with the user’s roles and responsibilities. Trusted authentication techniques should be implemented, and security processes and fixes should be updated from time to time. Exercise security consciousness from time to time to check for new forms of insecurity and act fast to protect data from attackers.
Accessibility across devices
Make sure that the content is readily available on different devices by applying the rules of responsiveness based on the monitor’s size and the pixels’ density. Use html5/up and css3 for better compatibility with computers, tablets, and smartphones. Help for mobile platforms for user-friendly and gesture controls for better performance enhancement. Devise an effective plan to test the application on different devices and systems, then execute the plan. Daily updates and work on the ease of use of the dashboard across all the users’ devices, as well as fine-tuning its performance.
Best practices for dashboard maintenance
Regular Updates and Revisions:
This involves frequently updating the dashboard with new data so that the information is current in its function and use. It presents the current position of the business environment, thus facilitating reaction to existing opportunities and threats. It also helps in upgrading the output with new analytical features and optimizing the interface.
Training and Support for Users:
Deliver training to users and periodically remind them how to use the dashboard effectively and thoroughly. This enables data analysis and decision-making proficiency and enhances the user’s ability to improve the financial picture in strategic planning and operational control. Users’ ongoing requests are met to answer inquiries, increase their faith in the CFO dashboard, and encourage consistent use across the company.
Conclusion
The use of a CFO dashboard entails the identification of significant financial management measures, the choice of visual representation methods, and easy-to-use data feeds. By focusing the specifics on the needs of CFOs, the elements of the dashboard will remain relevant and valuable. The timely performance of graphs and charts, as found in Biz Infograph dashboards, improves financial control by enabling the power of the flow of cash, profitability, and expenditure. It helps in timely decision-making, managing risks effectively, and planning effectively. In conclusion, it enhances financial performance by effectively utilizing resources, especially costs, and fosters sustainable economic growth and profitability.

Best Managed IT Services Companies for Proactive IT Support
IT issues don’t usually come up at an opportune time either; the failure of servers, security threats, or network slowdowns can disrupt business operations and cause delays that can end up being costly. That is why a number of companies turn to managed IT services with their emphasis on prevention rather than reaction.
The best managed IT service providers have all of the following capabilities: monitoring, automation, cybersecurity, maintenance, and technical skills. In addition, the proper provider is able to tailor its preventative strategy to fit the size of the company.
Best Managed IT Services Companies for Proactive Support
For firms considering IT management services, a more proactive approach is required than just basic help desk services. Proactive service involves monitoring systems and taking care of issues even before they turn into major problems.
1. Longi Engineering
Longi Enginuity Technologies is a strong choice for businesses seeking proactive managed IT support. Its approach focuses on maintaining reliable technology through continuous oversight, cybersecurity, technical support, and preventive IT management.
Proactive managed services ensure that any technical issues are detected prior to creating any disruptions. The process includes maintenance, security, and troubleshooting of the network to prevent any downtime.
2. IBM Managed Services
IBM Managed Services is highly suitable for large organizations with highly complicated IT setups. These include its strong points, such as hybrid cloud management, artificial intelligence, and IT operations at the enterprise level.
One of the greatest benefits is the analysis of infrastructure information by means of AIOps, which helps recognize possible problems that could affect the performance of IT infrastructures.
3. Accenture Managed Services
Accenture offers managed IT services along with cloud management, digital transformation, and cybersecurity. This comprehensive service offering makes Accenture a suitable choice for firms that deal with a complex IT landscape.
A proactive strategy offered by Accenture includes infrastructure monitoring, security analysis, and compliance management. This will help companies to uncover any potential problems that may affect their operations.
4. HCLTech
HCLTech offers managed infrastructure services, service desk support, automation, and hybrid workplace management. Its approach is particularly relevant for organizations that want routine IT tasks handled consistently.
The DRYiCE automation solution can facilitate automated maintenance and automated incident management. These processes will reduce the need for manual effort while resolving all the problems even before they arise.
5. Tata Consultancy Services
Tata Consultancy Services provides managed infrastructure and cloud services for large organizations operating at significant scale. Its services emphasize automation, monitoring, and efficient enterprise IT management.
TCS uses its Ignio AIOps platform to detect unusual system behavior and identify potential issues. Its automation capabilities can also support faster resolution and more consistent infrastructure performance.

Strong Managed IT Providers for Growing Businesses
Enterprise providers are not the only options for proactive IT support. Mid-market and growing businesses often need providers that combine continuous monitoring with responsive service, security, and practical IT management. Managed IT Services Connecticut represents this type of ongoing support, where businesses can rely on managed technology oversight instead of handling every IT issue internally.
6. Ntiva
Ntiva provides managed IT services, cybersecurity, compliance, and IT strategy. The company’s solutions are suitable for firms that require consistent supervision while not keeping all IT services within their walls.
Continuous monitoring helps in identifying technical and security issues early on. Also, because it is compliance-based, it is an ideal choice for firms that have to abide by certain regulatory standards.
7. Dataprise
Dataprise provides managed IT, cloud, infrastructure, and cybersecurity services for mid-market firms. The approach entails ensuring there is visibility within the technological environment of the business and finding any weaknesses that may exist.
Network assessment and threat hunting help in the proactive management of risks. Through this service, businesses will be able to manage any infrastructure or cybersecurity challenges proactively.
8. Thrive
Thrive provides managed IT services with a focus on cloud environments, cybersecurity, infrastructure, and digital transformation. Its services are suited to growing businesses managing increasingly complex technology systems.
Continuous application and network monitoring can help identify performance concerns early. Its hybrid cloud capabilities also support organizations moving between traditional infrastructure and cloud-based environments.
What Makes a Managed IT Provider Proactive?
The choice of a managed IT services company is not just about the comparison of its services. A true proactive vendor has an infrastructure set up in such a way that any issues can be detected and solved before downtime occurs. Connecticut managed IT services adhere to this philosophy by concentrating on management and not on technical problems.
Continuous Monitoring
A good provider will continuously monitor their networks, servers, endpoints, applications, and other systems. Notifications allow their technical staff to investigate any suspicious behavior and prevent it from becoming a bigger problem.
Automated Maintenance
Regular patching, updates, system checks, and routine maintenance reduce preventable technology problems. Automation helps these tasks happen consistently without depending entirely on manual intervention.
Integrated Cybersecurity
Preventive IT support is also crucial to handling security threats. Threat management, endpoint security, vulnerability management, and access control all play a role in minimizing the risk of turning a security threat into a breach.
Predictive IT Management
Sophisticated service providers employ analytical tools and automation to uncover trends that point towards future failure. Through this, IT departments can take action based on trends rather than user complaints.
Choosing the Right Provider for Proactive IT Support
The appropriate provider will be determined by the technology environment within the organization, the size of the organization, its security needs, and its business objectives. In some cases, the large corporation may need a provider that has hybrid cloud capabilities along with automation capabilities, whereas other organizations may need only a focused managed service partner.
Another criterion that an organization must consider when selecting an appropriate provider is that of processes and measurable performance standards for service delivery.

Building a More Proactive IT Environment
Proactive IT support is ultimately about preventing avoidable disruption. The strongest managed IT services companies continuously monitor technology, automate routine maintenance, strengthen security, and use data to identify emerging problems.
Selecting a provider with these capabilities creates a more structured approach to IT management. Longi Enginuity Technologies can support this proactive model through managed IT services designed around business technology needs. The right partnership helps turn IT from a source of unexpected problems into a stable foundation for daily operations.
Tech
Machine Safety Services and Control System Integration: Building Safer, Smarter Industrial Operations

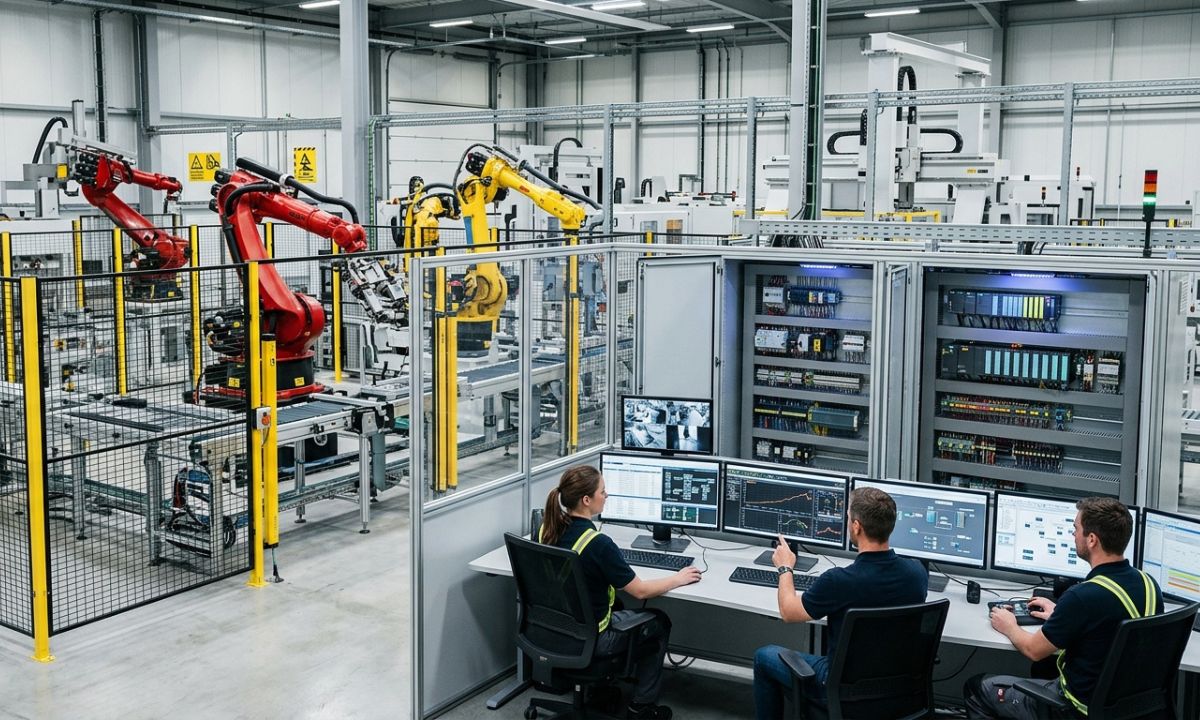
A production line can run thousands of cycles in a day without a problem. Then one small control failure, an outdated safety circuit, or a poorly integrated machine creates a serious interruption.
That is why modern industrial automation is no longer just about making equipment run faster. It is about making systems work together safely, reliably, and intelligently.
This is where machine safety services and control system integration become particularly important. Manufacturers and other industrial operators need more than individual machines with sophisticated controls. They need those machines, safety devices, sensors, software, and production systems to communicate effectively.
A well-designed automation system can improve productivity while also helping reduce operational risk, improve product consistency, modernize aging equipment, and give plant managers better visibility into what is happening on the production floor.
For companies dealing with legacy controls or increasingly complex production requirements, that combination can make a substantial difference.
Table of Contents
- What Are Machine Safety Services?
- Understanding Control System Integration
- Why Machine Safety and Automation Go Together
- Common Problems With Legacy Control Systems
- What a Control System Integrator Actually Does
- Key Benefits of Modern Automation Integration
- Machine Safety Services vs. Traditional Safety Upgrades
- How Pacific Blue Engineering Supports Industrial Automation
- Industries That Can Benefit From Control Integration
- Questions to Ask Before Starting an Automation Project
- Frequently Asked Questions
- Final Thoughts
What Are Machine Safety Services?
Machine safety services are engineering and technical services designed to identify and reduce hazards associated with industrial machinery and automated processes.
These services can involve reviewing existing equipment, identifying potential hazards, evaluating safety controls, and helping businesses implement appropriate protective measures.
Depending on the application, machine safety work may include:
- Safety risk assessments
- Machine guarding evaluation
- Safety circuit design
- Emergency stop systems
- Safety PLC implementation
- Interlocking systems
- Presence sensing devices
- Light curtains and safety scanners
- Safety relay systems
- Control system validation
- Safety documentation
- Machine modernization
The important point is that machine safety isn’t simply about adding an emergency-stop button and calling the job finished.
A machine may be technically functional while still having weaknesses in its safety architecture. For example, an outdated control panel may not communicate properly with newer safety devices. A modified production line may introduce hazards that weren’t present when the original machine was installed.
That’s why safety needs to be considered as part of the complete automation system.
Understanding Control System Integration
Control system integration involves bringing different automation components together so they operate as one coordinated system.
Think about a modern production facility. It may contain programmable logic controllers, variable frequency drives, robots, sensors, HMIs, industrial networks, safety systems, databases, and supervisory software.
If each component works independently, operators may spend unnecessary time troubleshooting problems and collecting information manually.
An experienced control system integrator connects these technologies and develops the control architecture needed for the application.
A typical integration project might include:
- Reviewing the existing process
- Identifying operational requirements
- Developing the control architecture
- Selecting suitable automation hardware
- Programming PLCs and HMIs
- Integrating sensors and field devices
- Connecting safety systems
- Establishing industrial communications
- Testing the system
- Commissioning the equipment
- Training operators and maintenance personnel
The goal isn’t simply to install new technology. The goal is to create a system that solves an actual operational problem.
Why Machine Safety and Automation Go Together
Safety and productivity are sometimes treated as separate objectives. In practice, they often overlap.
Consider a machine that frequently stops because operators have to manually intervene. If the safety and control architecture is poorly designed, diagnosing those stops can become difficult.
A modern integrated system can provide clearer information about what happened and why.
For instance, instead of simply showing that a machine stopped, an HMI might identify a particular safety device, interlock, sensor, or process condition that triggered the shutdown.
That information can shorten troubleshooting time.
It can also help maintenance teams identify recurring issues before they turn into larger production problems.
Honestly, this isn’t talked about enough: good safety engineering can contribute to better operational visibility, not just compliance.
Common Problems With Legacy Control Systems
Many industrial facilities are still operating equipment that was installed years or even decades ago.
There’s nothing inherently wrong with keeping reliable equipment in service. The problem begins when the control technology becomes difficult to maintain or integrate.
Common warning signs include:
Obsolete PLC Hardware
Older PLCs and processors may no longer be supported by their manufacturers. Replacement components can become expensive or difficult to locate.
Limited Data Visibility
Some older systems provide very little useful production data. Operators may know that something went wrong but have limited information about the cause.
Difficult Troubleshooting
Legacy systems may rely heavily on undocumented wiring, outdated programming practices, or components that newer technicians aren’t familiar with.
Inconsistent Safety Architecture
Equipment modifications performed over the years can leave safety systems fragmented or difficult to evaluate as a whole.
Poor Communication Between Machines
Older equipment may not communicate easily with modern manufacturing software, plant networks, or newer automation platforms.
Replacing an entire machine isn’t always the answer.
In many situations, control system modernization can extend the useful life of existing equipment while bringing its controls closer to modern operational standards.
What a Control System Integrator Actually Does
A control system integrator sits between the business problem and the technology used to solve it.
That distinction matters.
A good integrator doesn’t start with, “Which PLC should we install?” The better question is, “What does this process need to accomplish?”
From there, engineers can determine the appropriate hardware, software, networking, safety architecture, and user interface.
An experienced integrator may work on projects involving:
- PLC programming
- HMI development
- SCADA systems
- Industrial networking
- Robotics integration
- Motion control
- Variable frequency drives
- Safety PLCs
- Electrical control panels
- Data collection
- Process automation
- Legacy system modernization
- System commissioning
This approach becomes especially useful when a project involves multiple vendors or generations of equipment.
Someone has to make all those pieces work together.
Key Benefits of Modern Automation Integration
A properly planned automation project can affect much more than machine speed.
Improved Machine Safety
Modern safety systems can help identify hazards and provide controlled responses when unsafe conditions occur.
Better Product Quality
Automation can reduce process variation by controlling important parameters consistently.
Reduced Downtime
When control systems provide better diagnostic information, maintenance teams can often identify problems faster.
Lower Operational Risk
Replacing unsupported components and improving system architecture can reduce some risks associated with aging equipment.
Better Production Data
Integrated systems can collect valuable information about machine status, production rates, faults, energy use, and other operational factors.
Easier Maintenance
Clearer programming, documentation, interfaces, and diagnostics can make systems easier for maintenance teams to understand.
Longer Equipment Life
Modernizing controls may allow an otherwise useful machine to remain productive without replacing the entire mechanical system.
Better Decision-Making
Plant managers can make more informed decisions when reliable production information is available instead of relying entirely on manual observations.
Machine Safety Services vs. Traditional Safety Upgrades
| Traditional Approach | Integrated Machine Safety Approach |
|---|---|
| Focuses mainly on individual safety devices | Considers the complete machine and control architecture |
| Often reactive | Can be based on systematic risk assessment |
| Limited diagnostic information | Better fault and status visibility |
| May rely heavily on standalone components | Can integrate safety PLCs and control systems |
| May address one machine at a time | Can consider connected production processes |
| Documentation may be limited | Documentation and validation can be built into the project |
This doesn’t mean every facility needs the most sophisticated safety technology available.
Quite the opposite.
The right solution depends on the machine, process, hazards, operating environment, and business requirements.
How Pacific Blue Engineering Supports Industrial Automation
Pacific Blue Engineering is an example of an engineering company focused on control system integration and industrial automation.
Its work covers tailored automation solutions designed around the specific requirements of industrial operations rather than forcing every customer into the same technology package.
That distinction is important because no two production environments are exactly alike.
A manufacturing plant may need to modernize legacy controls while maintaining existing equipment. A food and beverage operation may have different process, sanitation, and production requirements. A life sciences facility can have its own demanding automation and documentation considerations.
Pacific Blue Engineering provides control system integration services across industries including manufacturing, food and beverage, life sciences, entertainment, and transportation.
Its engineering approach can help businesses address several common industrial challenges, including:
- Modernizing legacy control systems
- Improving machine safety
- Optimizing production processes
- Enhancing product quality
- Reducing operational risk
- Integrating automation technologies
- Improving access to operational information
The value of this type of engineering work isn’t limited to the initial installation.
A well-designed system should also make sense five or ten years later when someone needs to troubleshoot a sensor, modify a process, replace a component, or understand why a machine stopped.
That’s where thoughtful systems engineering earns its keep.
Industries That Can Benefit From Control Integration
Manufacturing
Manufacturers often need to balance throughput, quality, safety, and equipment availability. Integrated controls can help coordinate machines and provide better information about production performance.
Food and Beverage
Food and beverage facilities depend heavily on consistent processes. Automation can help control production parameters while improving visibility into equipment and process conditions.
Life Sciences
Life sciences operations can involve complex processes where consistency, traceability, and reliable automation are particularly important.
Entertainment
Entertainment facilities can use sophisticated automation and control systems for equipment, attractions, specialized machinery, and operational processes.
Transportation
Transportation environments may involve complex mechanical and electrical systems that require reliable monitoring, control, and integration.
The technologies differ between these industries, but the underlying principle remains similar: connect the right systems and make them work together reliably.
Questions to Ask Before Starting an Automation Project
Before selecting an integrator or beginning a major controls upgrade, ask a few practical questions.
What problem are we actually trying to solve?
Is the issue downtime, obsolete controls, poor data visibility, safety concerns, inconsistent quality, or something else?
Can the existing equipment be modernized?
Full replacement may not be necessary. A controls upgrade could potentially provide many of the required improvements.
How will the new system interact with existing equipment?
Integration planning is particularly important when old and new technologies need to coexist.
What information do operators need?
A technically impressive system isn’t very useful if operators can’t quickly understand what the HMI is telling them.
What happens after commissioning?
Ask about documentation, training, troubleshooting support, system maintenance, and future modifications.
How will safety be addressed?
Safety should be considered from the beginning of the project rather than treated as an afterthought.
Frequently Asked Questions
What are machine safety services?
Machine safety services help businesses identify machinery hazards and implement engineering controls and safety systems designed to reduce risk. They can include risk assessments, safety circuits, guarding evaluations, safety PLCs, interlocks, and validation.
What is control system integration?
Control system integration is the process of connecting automation hardware, software, machines, sensors, networks, and other technologies so they operate as a coordinated system.
Why modernize a legacy control system?
Legacy controls can become difficult to support, troubleshoot, or connect with modern technologies. Modernization can improve reliability, diagnostics, safety integration, data visibility, and maintainability while potentially extending the life of existing equipment.
Does automation improve machine safety?
Automation can support machine safety by integrating safety devices, monitoring hazardous conditions, and providing controlled responses. The appropriate solution depends on the specific machine, hazards, and risk assessment.
Can an integrator work with existing equipment?
Yes. Control system integrators often work with existing machinery and legacy controls. Depending on the equipment and project goals, modernization may involve replacing selected control components while retaining useful mechanical systems.
What industries use control system integration?
Control system integration is used across many sectors, including manufacturing, food and beverage, life sciences, transportation, entertainment, energy, and other industrial environments.
How can automation improve product quality?
Automation can reduce process variation by controlling equipment and process parameters consistently. Better monitoring and data collection can also help identify deviations earlier.
Final Thoughts
Industrial automation isn’t simply a race toward newer technology.
The real objective is more practical: safer equipment, dependable processes, useful information, and systems that make sense for the people who operate and maintain them.
That’s why machine safety services and control system integration should be considered together when businesses modernize industrial operations. A control system that runs efficiently but provides poor safety or visibility isn’t a complete solution.
Likewise, adding safety equipment without considering how the overall automation architecture works can leave valuable opportunities on the table.
Companies such as Pacific Blue Engineering demonstrate how systems engineering and automation technologies can be brought together to address those challenges across different industrial environments.
The next step for a facility considering modernization is often surprisingly simple: identify the machines, processes, or controls causing the most friction today. From there, a properly scoped engineering assessment can reveal what should be upgraded, what can stay, and where automation can deliver the greatest practical value.
Tech
Heavy Construction Equipment Financing: How to Smartly Scale Your Fleet Without Draining Cash Flow
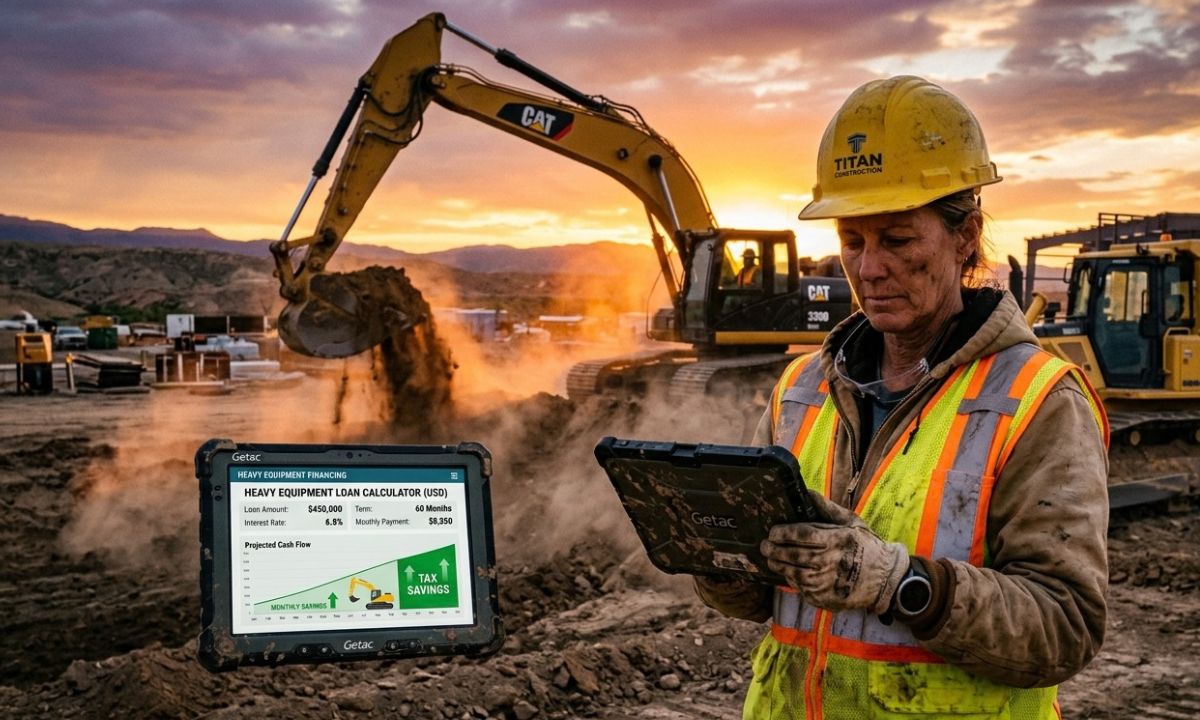
Did you know that a brand-new excavator can lose up to 20% of its resale value the second its tracks hit job site dirt? It is a stark reminder of how brutally capital-intensive the construction industry really is. Gear wears out, job specs change, and general contractors frequently take 60 to 90 days to settle invoices. Buying a $350,000 wheel loader outright with liquid cash sounds great on paper, but it often leaves a business vulnerable when payroll or unexpected site repairs loom next month.
That reality is why experienced fleet managers rely on strategic heavy construction equipment financing. Rather than locking up vital reserves in depreciating steel, top-performing contractors structure debt to align with project cash flows. If you have ever run figures through a heavy equipment financing calculator, you already know how slight variations in interest rates, term lengths, and down payments can drastically alter your bottom line.
In this guide, we will break down how modern equipment funding works, how to calculate payments accurately, and how specialized financing partners like Thirty3 Capital help contractors acquire essential machinery while keeping working capital intact.
The Hidden Trap of Buying Heavy Machinery with Cash
In my experience working alongside site prep subcontractors and civil engineering firms, the desire to own machinery debt-free is strong. Paying cash feels safe. There are no monthly statements, no interest charges, and no lender oversight. But in construction, cash is your ultimate safety net.
Consider a real-world scenario from a few seasons back. An earthmoving contractor in Ohio purchased two articulated dump trucks for $700,000 in cash right before spring. They had the funds in reserve, so paying outright felt like a milestone accomplishment. However, unseasonal rain delayed site grading by seven weeks. Because their cash reserves were locked in those dump trucks, they lacked the liquidity to cover operator payroll and fuel orders without taking out emergency, high-interest lines of credit.
Tying up cash in hard assets creates three distinct vulnerabilities:
- Illiquidity Risk: Machinery cannot be quickly converted back into cash to cover emergency expenses or project delays.
- Opportunity Cost: Capital tied up in iron cannot be used to bid on larger contracts, hire skilled labor, or secure performance bonds.
- Uneven Tax Spreading: Buying cash eliminates monthly interest deductions that could otherwise offset taxable operational revenue over time.
Comparing Cash Purchases vs. Strategic Financing
Choosing between paying cash and financing equipment comes down to how efficiently you deploy capital. Here is a direct breakdown of how the two approaches compare across core financial metrics.
| Financial Metric / Feature | Buying Outright with Cash | Heavy Construction Equipment Financing |
| Upfront Cash Outlay | Extremely High (100% of equipment price) | Low to Moderate (typically 0% to 20% down) |
| Working Capital Impact | Drains liquidity immediately | Preserves cash reserves for day-to-day operations |
| Bonding & Credit Capacity | Reduces cash balance on balance sheet | Capitalizes asset while establishing structured debt |
| Tax Strategy Flexibility | Limited to immediate or standard asset depreciation | Section 179, bonus depreciation, plus interest write-offs |
| Fleet Modernization Speed | Slow (limited by accumulated cash savings) | Fast (allows immediate fleet expansion as demand grows) |
| Seasonal Payment Adjustments | None (cost paid upfront regardless of work slumps) | Flexible (can structure seasonal or skip-payment schedules) |
The Core Types of Heavy Construction Equipment Financing
Navigating heavy construction equipment financing requires understanding which financial vehicle matches your operational goals. Not all debt is created equal, and choosing the wrong structure can cost tens of thousands over a five-year term.
1. Capital Leases (Finance Leases)
A capital lease operates much like a standard equipment loan. The lessee assumes the benefits and risks of ownership. On the balance sheet, the equipment is treated as an asset, and the lease obligation is recorded as a liability. At the end of the term, the contractor typically purchases the machine for a nominal amount (such as a $1 buy-out).
2. Operating Leases
If your company runs heavy equipment for specific long-term contracts and prefers to cycle into newer models every 36 to 48 months, an operating lease is often the preferred choice. Monthly payments are usually lower because you are only paying for the machine’s depreciation during the lease window. At term end, you can return the gear, purchase it at Fair Market Value (FMV), or extend the lease.
3. Asset-Backed Financing
Asset-backed financing uses existing, high-value fleet equipment as collateral to secure funding for new machinery or capital expansion. If your business owns several paid-off bulldozers or cranes, an asset-backed structure allows you to leverage that unencumbered equity. Lenders offer lower interest rates and higher approval thresholds because the loan is well-secured by tangible iron.
How to Master the Math with a Heavy Equipment Financing Calculator
Honestly, this isn’t talked about enough: basic auto loan calculators are almost useless when evaluating heavy machinery deals. Why? Because equipment finance involves soft costs (freight, dealer setup, specialized attachments, extended warranties), potential balloon payments, residual values, and non-standard payment rhythms.
A proper heavy equipment financing calculator accounts for all these variables to show your true total cost of ownership.
The Financial Formula Under the Hood
To understand how loan payments are generated, lenders utilize the standard amortization formula:
$$PMT = P \times \frac{r(1 + r)^n}{(1 + r)^n – 1}$$
Where:
- $PMT$ = Monthly payment
- $P$ = Principal amount (Total equipment price + soft costs – down payment)
- $r$ = Monthly interest rate (Annual Percentage Rate divided by 12)
- $n$ = Total number of monthly payments
Well… let’s break down a quick example to make this concrete.
Suppose you are looking at a mid-sized excavator priced at $280,000. The dealer adds $10,000 for transport, rigging, and a 3-year full-powertrain warranty, bringing the total acquisition cost to $290,000.
- Total Equipment Cost: $290,000
- Down Payment (10%): $29,000
- Financed Amount ($P$): $261,000
- Loan Term ($n$): 60 months (5 years)
- Interest Rate (APR): 7.5% annually ($r = 0.075 / 12 = 0.00625$)
Plugging these figures into the amortization formula:
$$PMT = 261,000 \times \frac{0.00625(1 + 0.00625)^{60}}{(1 + 0.00625)^{60} – 1}$$
$$PMT = 261,000 \times \frac{0.00625(1.4533)}{0.4533} = 261,000 \times 0.020038 = \$5,229.92$$
Your baseline monthly commitment would be roughly $5,230. If that machine generates $18,000 in monthly billable project work, the decision to finance yields an immediate net positive monthly cash flow of over $12,000.
Tailored Financing Solutions: The Thirty3 Capital Model
Traditional commercial banks often struggle with heavy construction deals. They evaluate a 50-ton excavator using the same rigid rigid metrics as a retail store lease, ignoring seasonal revenue drops, job-site wear, and specialized machinery values.
This is where dedicated industry specialists like Thirty3 Capital step in. Thirty3 Capital has earned a strong reputation for providing tailored financing options designed specifically around the operational realities of heavy machinery acquisitions.
Rather than trying to fit every contractor into a standard credit box, Thirty3 Capital focuses on custom structures, including:
- Asset-Backed Financing Flexibility: Utilizing existing fleet equity to back new machinery purchases, reducing cash-down requirements for growing contractors.
- Monthly Payment Planning Tools: Interactive tools that allow business owners to model seasonal adjustments, skip-payment options during winter months, and step-up structures that start with lower payments while equipment is being deployed.
- Soft-Cost Inclusion: Bundling transport fees, attachment costs, and extended service agreements into a single financed package so there are zero surprise out-of-pocket expenses.
By aligning payment schedules directly with a contractor’s revenue cycles, specialized firms help businesses acquire high-performance machinery while managing operational overhead efficiently.
5 Key Factors Lenders Evaluate Before Approving Your Deal
When applying for heavy construction equipment financing, underwriters look closely at specific indicators to gauge risk. Knowing what they evaluate allows you to present a stronger case and secure better rates.
1. Debt Service Coverage Ratio (DSCR)
Lenders want proof that your operational income comfortably covers existing and new debt obligations.
$$\text{DSCR} = \frac{\text{Net Operating Income}}{\text{Total Debt Service}}$$
A DSCR of 1.25x or higher shows that your business generates a 25% buffer above its debt requirements, which underwriters view favorably.
2. Credit Profile & Time in Business
While personal and business credit scores impact interest rates, lenders also weigh your track record. Contractors with more than two to three years of continuous operation often unlock lower rates and reduced down payment expectations.
3. Equipment Age and Type
Tier-1 equipment from major manufacturers (such as Caterpillar, Komatsu, Volvo, or John Deere) retains value far better than niche or obscure brands. Lenders offer better financing terms on reputable brands because their secondary market liquidation value is high and predictable.
4. Project Pipeline & Backlog
Demonstrating signed contracts or a healthy project backlog proves that the newly acquired equipment will be put to work immediately, generating the revenue required to service the loan.
5. Fleet Utilization Rate
If your current fleet operates at 85% capacity or higher, adding a new unit is easy to justify. Lenders want assurance that new equipment will drive incremental revenue rather than sit idle in a yard.
Leveraging Section 179 and Depreciation for Maximum Tax Savings
Some experts disagree on the best tax approach for heavy machinery, but here is my take: failing to coordinate your equipment purchases with your CPA is like leaving money on the table.
Under Section 179 of the IRS Tax Code, qualifying businesses can deduct the full purchase price of eligible new or used heavy equipment financed and placed in service during the tax year.
How Section 179 Supercharges Financing
- Immediate Deduction: Instead of depreciating a $300,000 machine slowly over 5 to 7 years, you can write off the full purchase price in Year 1.
- Tax Savings Exceed Cash Down: If you place a $300,000 machine in service using a 10% down payment ($30,000) and fall into a 30% tax bracket, your first-year tax savings could reach $90,000 ($300,000 x 30%).
In effect, your first-year tax savings can significantly exceed your initial cash down payment, creating a positive net cash position almost immediately.
Frequently Asked Questions
What is heavy construction equipment financing?
Heavy construction equipment financing is a specialized funding method that allows contractors to acquire heavy machinery, such as excavators, cranes, and bulldozers, through loans or leases rather than paying the full purchase price upfront in cash.
How does a heavy equipment financing calculator work?
A heavy equipment financing calculator estimates your monthly payments by factoring in the machinery’s total purchase price, down payment, interest rate, term length, and soft costs like freight and extended warranties.
Can I finance used heavy machinery?
Yes, used equipment from major manufacturers can be financed easily. Lenders evaluate the machine’s age, operating hours, overall condition, and market value to determine appropriate loan terms and interest rates.
What down payment is typically required for heavy equipment loans?
Down payment requirements generally range from 0% to 20%, depending on your business’s credit profile, time in operation, asset value, and whether you utilize asset-backed financing strategies.
How does Thirty3 Capital customize payment structures?
Thirty3 Capital tailors financing solutions by offering seasonal payment schedules, skip-payment options during slow weather periods, and asset-backed structures that leverage existing fleet equity to lower upfront cash demands.
What is the main difference between an equipment loan and an operating lease?
An equipment loan transfers full ownership of the machinery to you upon term completion, whereas an operating lease functions more like a long-term rental where you return or purchase the machine at fair market value at the end of the term.
Final Thoughts and Fleet Strategy
Scaling a construction business requires a careful balance between managing risk and seizing market opportunities. While paying cash for machinery may seem like the safest path, preserving liquidity through strategic financing is often what allows a business to weather unexpected downturns and take on larger contracts.
By utilizing modern planning tools, running precise projections through a heavy equipment financing calculator, and partnering with industry experts like Thirty3 Capital, you can build a modern, high-performing fleet while keeping your working capital right where it belongs: working for you.
-
 Education2 years ago
Mastering Excel: Your Comprehensive Guide To Spreadsheets And Data Analysis
-

 Tech2 years ago
How To Choose The Best Forex Trading Broker?
-

 Business2 years ago
Exploring the Rental Market: Properties for Rent in Malta
-

 Blog2 years ago
Arab MMA Fighters Shine Bright: Meet the Champions of PFL MENA
-

 Tech2 years ago
The Role Of Experts VS Top Mobile Apps for Green Screen Removal
-

 Travel2 years ago
Experience the Best Desert Safari Dubai Offers!
-

 Home Improvement2 years ago
Eco-Friendly Round Rug Options for Sustainable Living in NZ
-
 How-To Guides2 years ago
Comprehensive Guide to Cockwarming: Enhancing Intimacy and Connection